African Americans most likely to be targets of hate crimes
It is far more likely for African Americans to be targeted in a hate crime compared to other bias types in the U.S.
According to the FBI Crime Data Explorer, hate crimes against African Americans made up nearly 30% of all reported hate crimes in the U.S. in 2022, outpacing those related to religion, sexual orientation and other races or ethnicities.
More than 11,600 hate crimes were reported in the U.S. in 2022 and more than 3,400 of those cases were related to African Americans. Brendan Lantz, an associate professor in Criminology and Criminal Justice Studies and Director of the Hate Crime Research and Policy Institute at Florida State University, said he wasn’t surprised about this distinctive difference between African Americans and other bias types.
“We have a long history of strained racial relations and racism towards Black people in this country, and what that means is that a lot of hate crimes happen within the context of history,” Lantz said. “Hate crimes tend to happen as an extension of intergroup conflict that’s already happening within a location, so this country in particular has a history of marginalizing Black people.”
The data also showed this trend has been consistent for 30 years. Since 1992, there hasn’t been a single year where a bias type came within 1,000 reported incidents of the number reported for African American hate crimes.
“We draw on this notion of path dependence. Path dependence basically argues that whether you’re thinking at the individual level, the contextual level, the institutional level and in your daily life, it’s easier to continue doing the things that you already do than to change,” Lantz said. “If you have racism that’s embedded within institutions, racism that’s embedded in communities. … They just perpetuate over time through generations.”

Another key finding the data revealed is that hate crimes against African Americans have drastically increased from about 2,000 in 2018 to nearly 3,500 in 2020. Norman Rose, an associate professor in Sociology and Criminology at Kent State University, said this increase might be due to individuals feeling as if African Americans have already achieved their “rightful place” in society.
“African Americans are now pointing out that there are still injustices in society. A lot of whites don’t want to hear that or don’t believe it, or they think it’s over the top, that they just want to paint themselves as victims,” Rose said. “A lot of whites don’t buy into the idea that these problems still exist.”
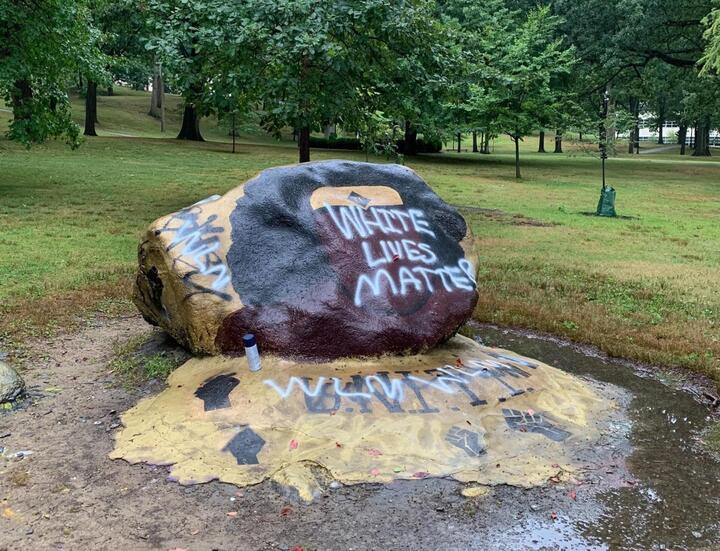
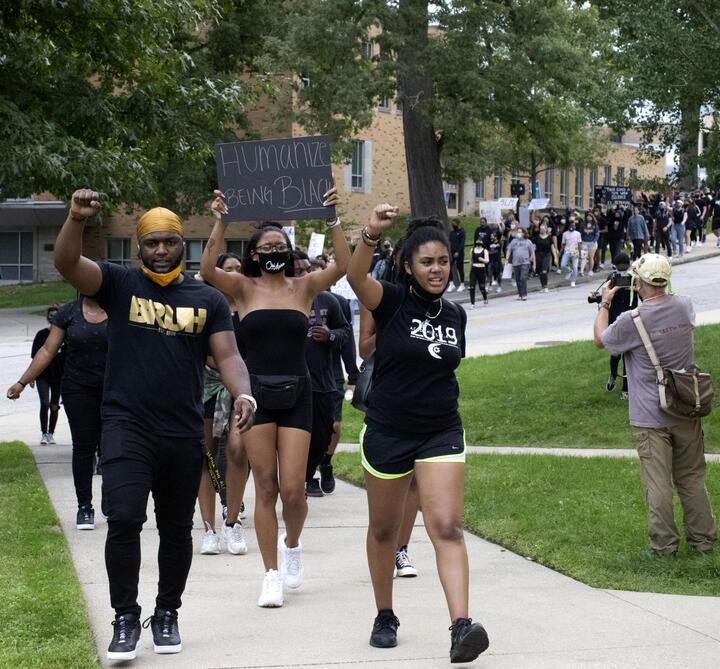
2020 also marked the year of the Black Lives Matter and George Floyd Protests which significantly increased the amount of racial tension between white and black individuals. In some cases, white individuals blamed African Americans for damage caused and crimes committed by protestors during the demonstrations.
“A lot of whites don’t buy into the idea that these problems still exist.”
Norman Rose – Kent State University Associate Professor of Sociology and Criminology
Lantz said these social and political events greatly contribute to the rate of hate crimes because they cause individuals to take sides based on differences, and in this case the differences were race and ethnicity. While most African Americans weren’t responsible for any damage caused during the George Floyd protests, some individuals collectively blamed them for the problem.
“Groups start to identify people that they believe are offending them, and then they view the people within those groups as interchangeable,” Lantz said.

This data comes from the Uniform Crime Reporting (UCR) Program where crime data is collected by local law enforcement agencies, submitted to centralized state agencies such as the Ohio Office of Criminal Justice Services, and then reported to the FBI. Alan Wedd is a Social Science Research Supervisor for the Ohio Office of Criminal Justice, and he said this data has a number of benefits for the public and government.
“If there’s laws being enacted or policies being passed they (the government) might use crime data to make those decisions or to evaluate those decisions,” Wedd said. “It’s also useful for taking a look at what different groups are being affected by crime and how hate and bias crime affects different groups.”
All of the data originates at the local and state levels, and this means that each state’s hate crime data can be tracked from number totals to types of biases. California had the most reported cases of African American hate crimes with 643 in 2022, while Ohio came in fourth place with 161.
However, this can be misleading because some states have fewer regulations regarding law enforcement’s reporting of hate crime data. Which means numbers in other states could be much higher than the data shows.
“Not every state records data to law enforcement equally, so there’s not a national mandate for law enforcement to be recording crime, and so crime reporting tends to vary from state to state,” Wedd said. “Ohio’s very fortunate that we’ve had the Ohio Incident-Based Reporting System program for a long time, and also law enforcement has been willing to participate in it. … We put a lot of effort into accurately collecting hate crime data and also validating hate crime data.”
“Not every state records data to law enforcement equally, so there’s not a national mandate for law enforcement to be recording crime, and so crime reporting tends to vary from state to state.”
Alan Wedd – Social Science Research Supervisor
The states with the least amount of reported hate crime data (especially those related to African Americans) are located in the American South including states such as Mississippi and Louisiana. Lantz said there is very much a correlation between these low numbers and the South’s past.

“What we see in our research is that the American South, where obviously the institution of black slavery was centered, tends to be the worst region in the country at policing hate crimes and responding to hate crimes,” Lantz said. “Law enforcement agencies in the American South either don’t report hate crime statistics at all, or they do this thing that we refer to as ceremonies compliance where year after year they just say ‘we have no hate crime.”’
Another challenge with the data is that it doesn’t show possible factors or causes that may contribute to increases, decreases, or spatial distribution in regards to hate crimes.
“These types of data are what’s known as descriptive data; with descriptive data their really useful for describing what’s going on,” Wedd said. “Descriptive data is like a first step showing what’s going on; if you want to get to the why you typically need some additional information.”
“What we see in our research is that the American South, where obviously the institution of black slavery was centered, tends to be the worst region in the country at policing hate crimes and responding to hate crimes.”
Brendan Lantz – Florida State University Associate Professor of Criminology and Criminal Justice Studies and Director of the Hate Crime Research and Policy Institute
Due to the rate at which hate crimes are increasing, it’s important to look at possible solutions to decrease current trends. Rose said a possible strategy is for African Americans to encourage more white individuals to support their cause without alienating them.

“A lot of black people blame white people (for slavery and segregation) and express animosity towards them,” Rose said. “To be targeted as the bad guy because you’re white alienates people that could be allies to the African American cause; because there are white people who recognize these issues are still a problem, but they don’t feel like they are to blame for it.”
In terms of figuring out a long-term solution, utilizing the hate crime data might be the most effective approach.
“Looking at hate crime data gives us a useful starting point for thinking about how we start to address this issue, where are we at now and where do we want to be,” Wedd said. “If there is particular initiatives that take place to get reduced hate crimes for a particular group this data is one resource that can be used to evaluate ‘is this method doing well in our city and do we want to take this to other parts of the country to try to get this replicated?”’